
The October Effect
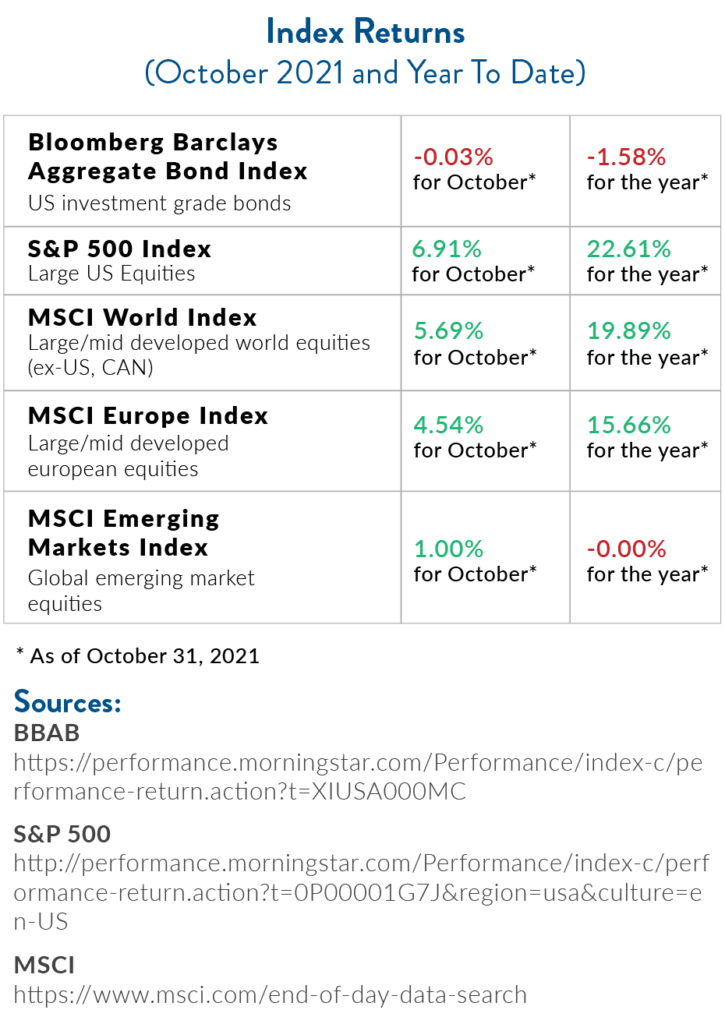
As we fall back to standard time and the days get shorter, we will take this opportunity to look back at the month of October and the issues facing us as we head towards year end. The S&P 500 added 6.9% in October, the largest one-month gain since November 2020.[1] We also saw multi-year highs in inflation readings and energy prices,[2] as well as better-than-expected corporate earnings.
As of October month-end, 82% of companies reported earnings above estimates, exceeding the five-year average of 76%. On average, that outperformance has been 10.3% higher than estimates (compared to a five-year average of 8.4%)[3].
Where will things go from here?
Inflation Jumps (Even More)
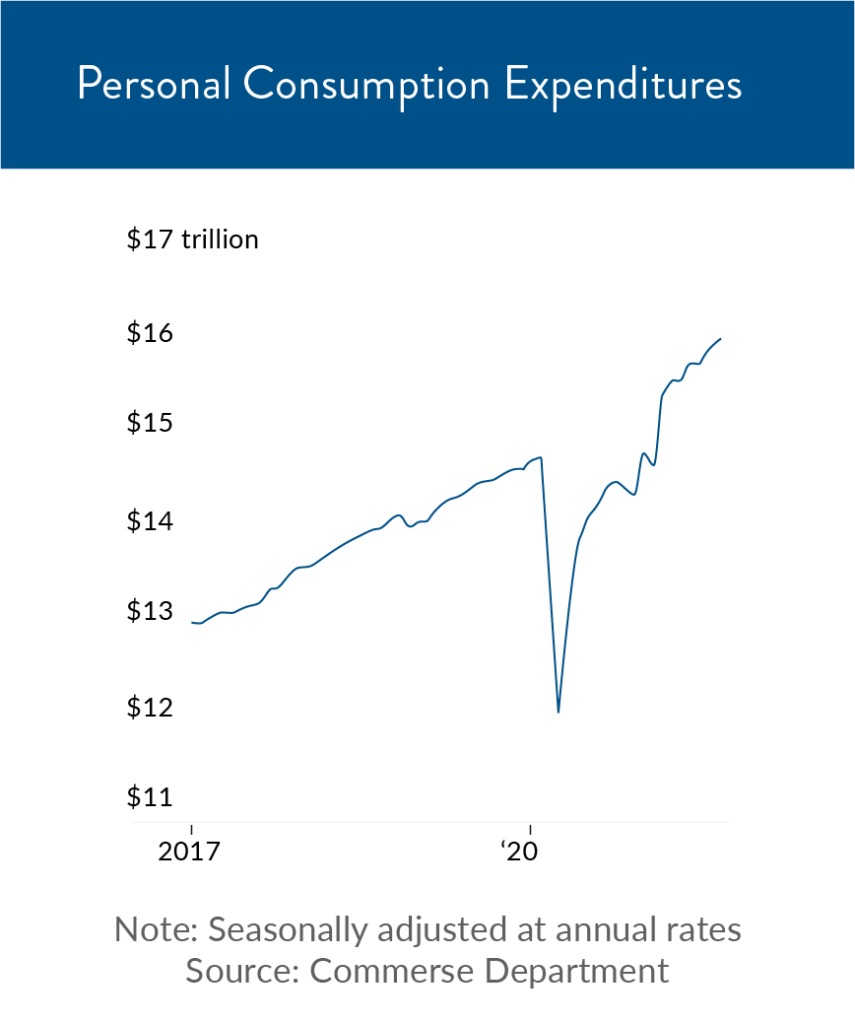
October was a fantastic month for investors, but worries about inflation (as well as actual inflation readings) could put pressure on both the Fed and on markets—not to mention consumers.In September, the U.S. Core Personal Consumption Expenditures index jumped 4.4% year-over-year, the fastest pace in 30 years.[4] This index tracks prices for domestic purchases and is watched closely by the Federal Reserve.
We’ve talked about inflation before, which the Fed has stated is “expected to be” transitory. The Fed also recently announced that it will begin tapering its asset purchases in November, an initial step towards reining in monetary policy.[5]
The question is how transitory inflation will be—and what it means for consumers in the meantime.
Milk price inflation (4% in the last year) has gotten a bit of press recently, but consider that boneless chuck roast prices are up 28%. Consumers with cars are also feeling prices at the pump—gas is up 61% from a year ago. [6]
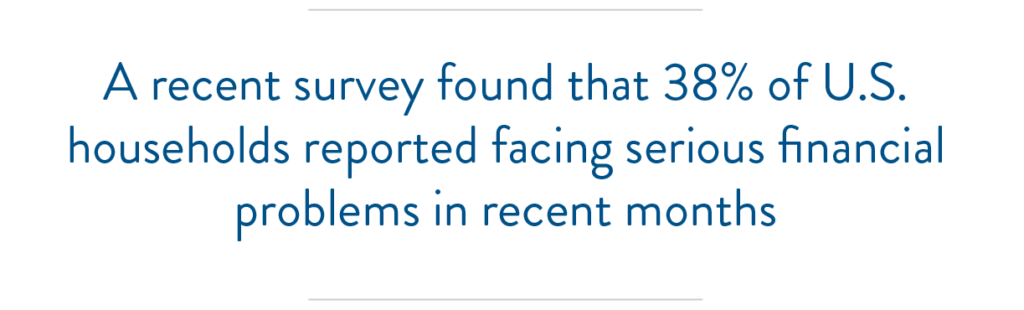
These kinds of changes could be impacting some of the decline in financial security reported among Americans. A recent survey found that 38% of U.S. households reported facing serious financial problems in recent months, with nearly one-third of respondents saying they were worse off now than at any other time since the start of the pandemic. [7]
 We’re also seeing a divergence in the labor markets. In October, the number of job openings reached close to a record high, with an increase of 62% over the past year.[8] However, overall hiring has declined, Americans are quitting at a record rate, and the labor force participation rate remains low at 61.6% (a rate last seen in 1976). [9],[10]
Lack of childcare due to daycare closures is partly to blame, and women have dropped out of the workforce in droves, sparking the lowest female labor force participation rates since the 1970s.[11] It’s hard to say how this will play out over the coming months with the new availability of a children’s vaccine for COVID-19, but overall we think it’s safe to say that the complexities in the labor market will likely persist.
Tax Changes on the Horizon?
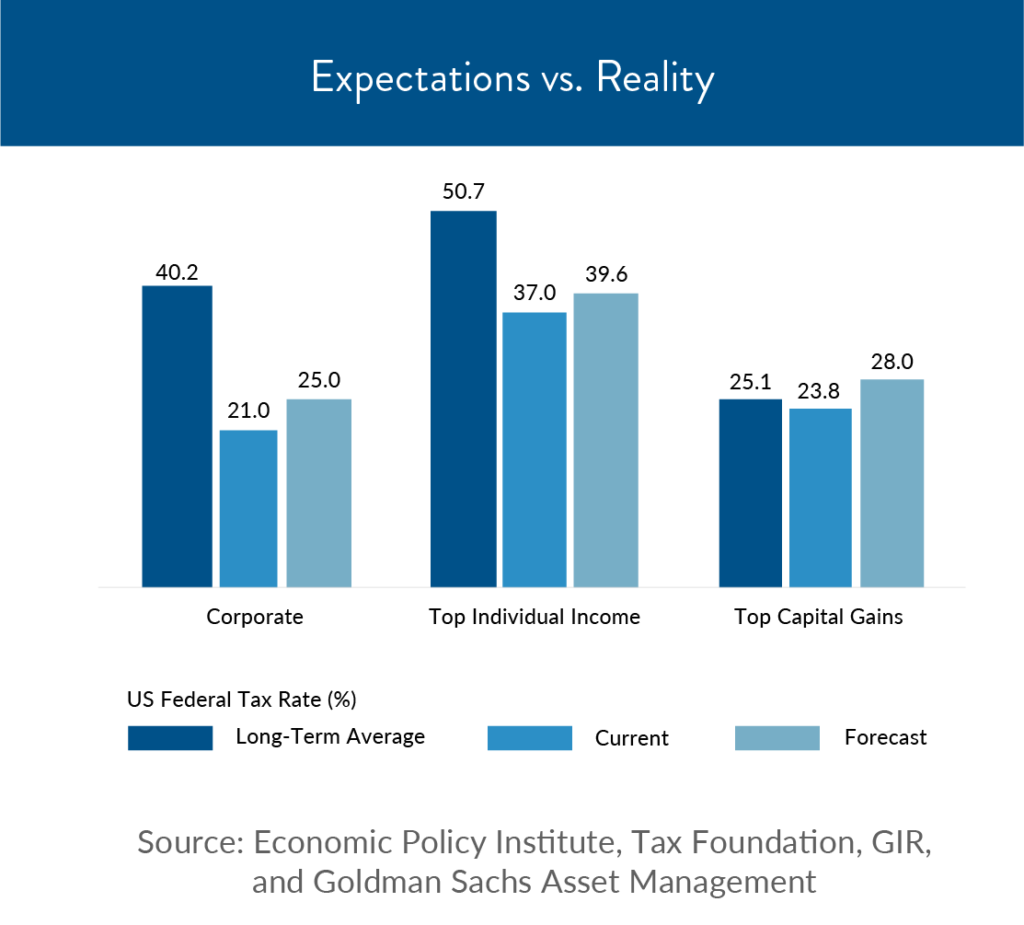
Another issue we are following closely is tax policy. With public spending at record highs and tax rates at historical lows, it stands to reason that tax rates will revert to historic averages.[12] How this evolves, of course, remains to be seen—current proposals have higher rates on capital gains, tax increases on annual income over $10 million and greater corporate taxes.
While we’ll need to wait and see the direction of negotiations in Congress, we are closely watching the situation and consulting with our network of accounting specialists on potential risk areas and year-end planning opportunities for clients.
Overall, it’s clear to us that the process of emerging from the pandemic is far from over—with higher short-term inflation and labor market challenges, we’ll likely continue to feel the impact for some time. We will continue to provide as much insight and information on these matters as we can, including the continuation of our educational webinars.
If there are any questions or topics you’d like us to cover, please don’t hesitate to let us know! We love hearing from you about what’s on your mind.
Please call us to schedule your year-end meeting if we have not already reached out to you. One thing that is constant is change and our goal is to stay ahead of possible changes and help you plan accordingly.
Download print version of this article.
The information expressed herein are those of JSF Financial, LLC, it does not necessarily reflect the views of NewEdge Securities, Inc. Neither JSF Financial LLC nor NewEdge Securities, Inc. gives tax or legal advice. All opinions are subject to change without notice. Neither the information provided, nor any opinion expressed constitutes a solicitation or recommendation for the purchase or sale of any security. Investing involves risk, including possible loss of principal. Indexes are unmanaged and cannot be invested in directly.
Historical data shown represents past performance and does not guarantee comparable future results. The information and statistical data contained herein were obtained from sources believed to be reliable but in no way are guaranteed by JSF Financial, LLC or NewEdge Securities, Inc. as to accuracy or completeness. The information provided is not intended to be a complete analysis of every material fact respecting any strategy. The examples presented do not take into consideration commissions, tax implications, or other transactions costs, which may significantly affect the economic consequences of a given strategy. Diversification does not ensure a profit or guarantee against loss. Carefully consider the investment objectives, risks, charges and expenses of the trades referenced in this material before investing.
Asset Allocation and Diversification do not guarantee a profit or protect against a loss.
The Bloomberg Barclays U.S. Aggregate Bond Index measures the investment-grade U.S. dollar-denominated, fixed-rate taxable bond market and includes Treasury securities, government-related and corporate securities, mortgage-backed securities, asset-backed securities and commercial mortgage-backed securities.
The S&P 500 Index is an unmanaged, market value-weighted index of 500 stocks generally representative of the broad stock market.
The MSCI World Index is a broad global equity index that represents large and mid-cap equity performance across 23 developed markets countries and covers approximately 85% of the free float-adjusted market capitalization in each country.
The MSCI Europe Index captures large and mid-cap representation across 15 developed markets countries in Europe and covers approximately 85% of the free float-adjusted market capitalization across the European Developed Markets equity universe.
The MSCI Emerging Markets Index captures large and mid-cap representation across 26 emerging markets countries and covers approximately 85% of the free float-adjusted market capitalization in each country.
Gross domestic product (GDP) is a monetary measure of the market value of all the final goods and services produced in a specific time period. GDP is the most commonly used measure of economic activity.
By clicking on these links, you will leave our server, as they are located on another server. We have not independently verified the information available through this link. The link is provided to you as a matter of interest. Please click on the links below to leave and proceed to the selected site.
[1] https://www.nytimes.com/2021/10/29/business/stock-market-record.html
[2] https://www.wsj.com/articles/soaring-energy-prices-raise-concerns-about-u-s-inflation-economy-11633870800
[3] https://insight.factset.com/sp-500-earnings-season-update-october-29-2021
[4] https://www.wsj.com/articles/consumer-spending-personal-income-inflation-september-2021-11635449959?mod=hp_lead_pos1
[5] https://www.cnbc.com/2021/11/03/fed-decision-taper-timetable-as-it-starts-pulling-back-on-pandemic-era-economic-aid-.html
[6] https://www.bloomberg.com/news/articles/2021-11-04/american-milk-is-getting-more-expensive-with-prices-up-26?srnd=premium&sref=c4RUGNV1
[7] https://media.npr.org/assets/img/2021/10/08/national-report-101221-final.pdf
[8] https://fred.stlouisfed.org/series/JTSJOL
[9] https://fred.stlouisfed.org/series/JTSQUR
[10] https://fred.stlouisfed.org/series/CIVPART
[11] https://www.wsj.com/articles/millions-of-workers-stay-home-to-watch-young-children-as-daycares-struggle-11635087600?mod=article_inline
[12] Goldman Sachs Asset Management
Performance table sources:
BBAB: https://performance.morningstar.com/Performance/index-c/performance-return.action?t=XIUSA000MC