
Climbing a Wall of Worry
There’s an old saying that the markets climb a wall of worry, and August exemplified this. The S&P 500 closed the month with 7 months of gains despite rising worry about the Delta variant of COVID-19, inflation, and employment.[1]
 What’s Moving Markets?
We’ve continued to have something of a mixed bag of news in the markets and economy. Second quarter corporate profits were incredibly strong, with 89% of companies beating expectations (out of 98% of companies that had reported earnings by the end of August).[2] At the same time, jobs growth slowed in August, with the economy adding just 235,000 workers compared to an expected 733,000.[3]
Some economists expect this dampened pace to continue as the risks of Delta are assessed and potentially work their way through the economy—particularly in the industries most affected by COVID-19.
What happens in the next month or two could provide important clues for both investors and the Fed. With supplementary federal unemployment benefits ending and schools starting up again, there could be more available workers for open jobs. However, we’ll simply need to see what happens next.
Spotlight on Municipal Bonds
We want to take a pause from our normal economic reporting to focus in on an asset class that’s of high importance to many of our clients. Many investors maintain municipal bond positions as a core holding in their portfolios, and in the current market environment, where yields are low and prices relatively high, we naturally have a lot of questions and much to talk about!
The major question of the pandemic was whether municipal bonds would be impacted by a recession and decreasing tax revenues. In fact, many bond issuers weathered the pandemic better than expected; for example, California is expecting a $26 billion budget surplus for the 2020-2021 tax year.[4] Municipal bond issuance also grew, with outstanding debt growing by more than $100 billion in the year ending March 31.[5]
So what now? An environment of low yields (and rising prices) can make municipals look somewhat unattractive. But we think it’s important to remember what makes municipal bonds attractive in the first place:
● They provide a shelter from federal income tax and, if you buy municipal bonds issued by your home state, from state income taxes
● They are stable, with low volatility and very low default rates
● They can be accessed at a competitive cost
Even a low yield, when shielded from tax and accessed at a low cost, can provide considerable benefits in the appropriate situation. With that in mind, we have generally advised our clients with municipal bond allocations to maintain them.
 While there are situations where it might make sense to look towards other opportunities, we believe these must be taken on a case-by-case basis and weighed carefully against your particular needs and risk factors.
As we’ve often said in these notes, prudence and a long-term view are very important factors in any kind of investment management decision. While municipal bonds don’t offer a lot of excitement or, currently, an enormous amount of yield, we believe that for many situations they remain a prudent and appropriate asset class that sometimes doesn’t get enough credit.
If you have any questions about your own allocation or the recommendations we’ve made for your situation, please don’t hesitate to reach out! Each asset class has unique features, potential benefits, and risks, and we’re here to navigate and balance them in a way that makes sense for you.
Where Will Things Go From Here?
There is much on the horizon, of course. The risks posed by the spread of the Delta variant of COVID-19, the potential for President Biden’s infrastructure plan, tax policy, Fed policy, and any number of other factors could have an impact on markets both through the rest of 2021 and beyond.
 That said, with markets high and valuations so rich, investors are inclined to ask whether it makes sense to continue putting money in the market. If your objectives lie beyond the short term, we believe that staying true to your strategy is the most appropriate response.
Consider this simple but illustrative chart from Goldman Sachs: it shows what would have happened over time if you’d invested on the best days, the worst days, and on the first day of each year from 2000 onwards.
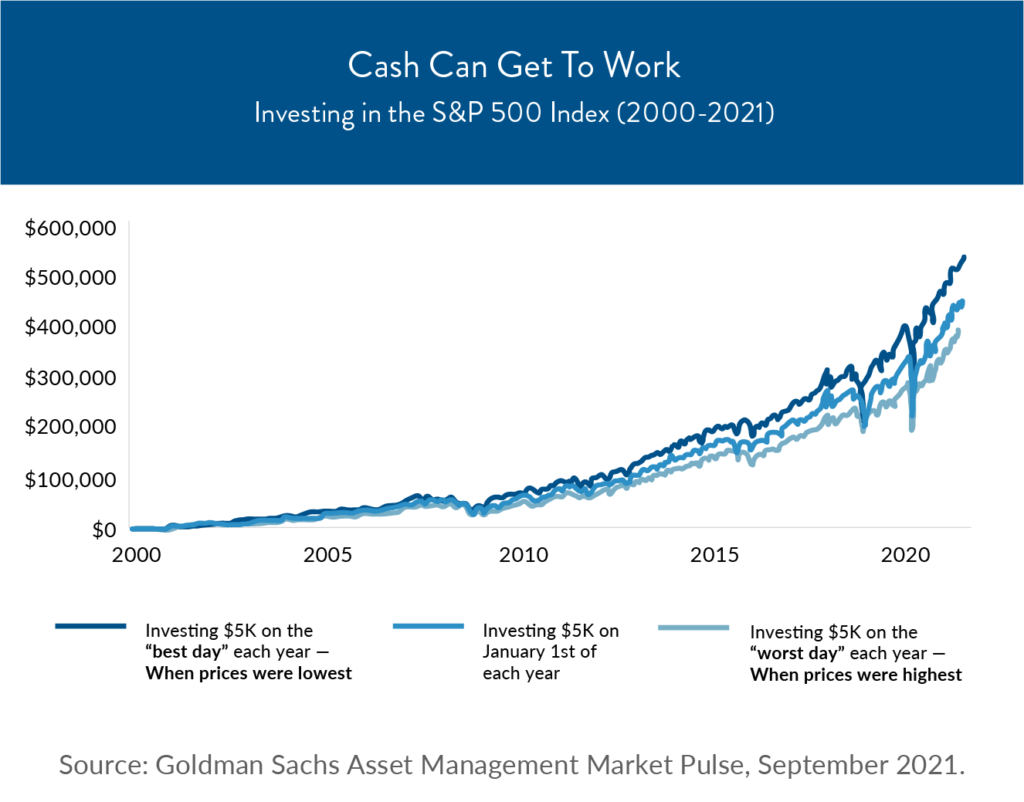
As you can see, there’s some difference in performance, of course. But trying to time the market for those best days—which are only known to us after the fact—means that, realistically, attempting such a strategy is likely to leave you far worse off. After all, you’d have to be right 100% of the time in order to perform to this level.
The investment plan that we’ve designed with you may provide for short-term opportunistic trades, but generally speaking most of our clients are oriented towards the long run. To that end, so are the majority of the investment plans we work with you to create. While short-term market movements can be exciting (or frightening), the plan you have in place was designed with that volatility in mind.
If you have any questions at all about your personal investment plan or what’s going on in markets these days, please don’t hesitate to give us a call.
Somehow, it’s already the beginning of fall and we want to take a moment to wish you a healthy and happy back to school season. Though it’s still September, please feel free to reach out to us to schedule your fourth quarter meeting. Before we know it, it’ll be New Year!
Download print version of this article.
The information expressed herein are those of JSF Financial, LLC, it does not necessarily reflect the views of Mid Atlantic Capital Corporation (MACC). Neither JSF Financial LLC nor MACC gives tax or legal advice. All opinions are subject to change without notice. Neither the information provided, nor any opinion expressed constitutes a solicitation or recommendation for the purchase or sale of any security. Investing involves risk, including possible loss of principal. Indexes are unmanaged and cannot be invested in directly.
Historical data shown represents past performance and does not guarantee comparable future results. The information and statistical data contained herein were obtained from sources believed to be reliable but in no way are guaranteed by JSF Financial, LLC or MACC as to accuracy or completeness. The information provided is not intended to be a complete analysis of every material fact respecting any strategy. The examples presented do not take into consideration commissions, tax implications, or other transactions costs, which may significantly affect the economic consequences of a given strategy. Diversification does not ensure a profit or guarantee against loss. Carefully consider the investment objectives, risks, charges and expenses of the trades referenced in this material before investing.
Asset Allocation and Diversification do not guarantee a profit or protect against a loss.
The Bloomberg Barclays U.S. Aggregate Bond Index measures the investment-grade U.S. dollar-denominated, fixed-rate taxable bond market and includes Treasury securities, government-related and corporate securities, mortgage-backed securities, asset-backed securities and commercial mortgage-backed securities.
The S&P 500 Index is an unmanaged, market value-weighted index of 500 stocks generally representative of the broad stock market.
The MSCI World Index is a broad global equity index that represents large and mid-cap equity performance across 23 developed markets countries and covers approximately 85% of the free float-adjusted market capitalization in each country.
The MSCI Europe Index captures large and mid-cap representation across 15 developed markets countries in Europe and covers approximately 85% of the free float-adjusted market capitalization across the European Developed Markets equity universe.
The MSCI Emerging Markets Index captures large and mid-cap representation across 26 emerging markets countries and covers approximately 85% of the free float-adjusted market capitalization in each country.
Gross domestic product (GDP) is a monetary measure of the market value of all the final goods and services produced in a specific time period. GDP is the most commonly used measure of economic activity.
By clicking on these links, you will leave our server, as they are located on another server. We have not independently verified the information available through this link. The link is provided to you as a matter of interest. Please click on the links below to leave and proceed to the selected site.
[1] Source: https://www.nasdaq.com/articles/august-2021-review-and-outlook-2021-09-01
[2] Source: https://www.nasdaq.com/articles/august-2021-review-and-outlook-2021-09-01
[3] Source: https://www.ft.com/content/2b66803b-59a4-4596-be91-ccb241043864
[4] Source: https://www.wsj.com/articles/states-expected-covid-19-to-bring-widespread-tax-shortfalls-it-didnt-happen-11615372201?mod=article_inline
[5] Source: https://www.wsj.com/articles/if-you-bought-municipal-bonds-a-long-time-ago-this-is-a-great-time-11629797580