
A Record-Setting July—With Some Risks Ahead
Despite the resurgence of COVID-19 in the form of the delta variant, equity markets reached record highs in July.[1] Of the S&P 500 companies that reported earnings in the month, 88% beat expectations and 84% had positive topline results.
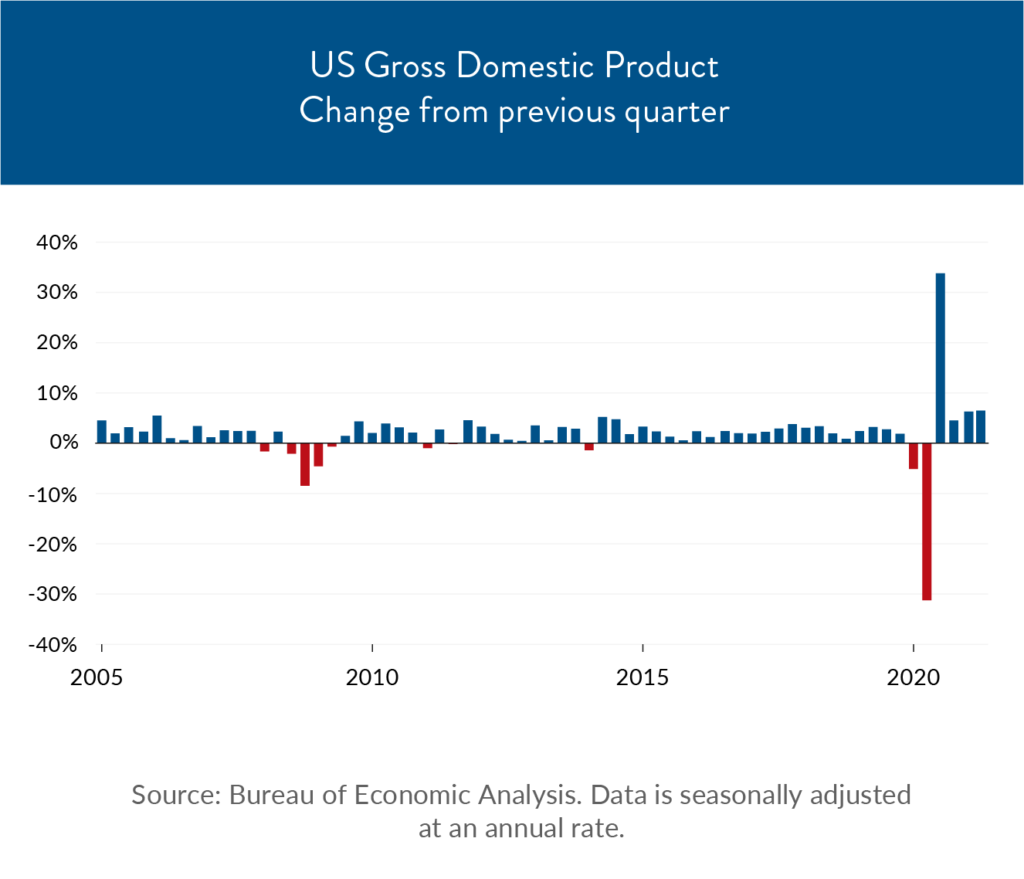
The economic expansion also continued: U.S. gross domestic product (GDP), a measure of economic output, rose 6.5% in the second quarter on an annualized basis, lower than the anticipated 8.4% gain. First quarter growth was revised down to 6.3%.[2] These growth levels brought U.S. economic activity back to pre-pandemic levels (adjusted for inflation).[3] By contrast, it took two years for GDP to recover after the financial crisis.[4]
So, what comes next?
Economic Growth
While the growth rate was strong by any normal standard, it was lower than the anticipated 8.4% gain. Going forward, the potentially waning impact of pent-up consumer demand and fiscal stimulus could continue to slow the momentum of the recovery.[5]
Consumer spending accounted for 69% of economic activity, so if consumers start to scale back their spending, we could feel the impact relatively quickly. After all, enhanced unemployment benefits are set to expire in September and there is still a fairly large disconnect between jobs and workers—namely, there are more open jobs than there are unemployed people, and yet jobs are going unfilled and unemployment benefit applications remain elevated.[6], [7]
We’ve touched on this particular puzzle previously, and as we’ve said there are likely several drivers for the phenomenon which could take some time to work out.

This presents a bit of a challenge for the economic recovery, and it also ties into the question of inflation. Wages have started to rise for lower-income workers as companies attempt to lure employees back, and overall inflation has also risen. While the state of wage inflation remains to be seen, the Federal Reserve has described the broader inflationary trends as “transitory,”[8] meaning that they’re primarily being driven by temporary factors and are likely to loosen over the course of the recovery.
Corporate Profits
In line with the rebound, estimates indicate that corporate profits are poised to hit their highest level in over two decades in the U.S. and will reach pre-financial crisis levels in Europe and Asia.[9] The next couple of quarters are expected to also be very good for corporate earnings.
That said, there are potential headwinds—namely rising labor costs, inflation, short-term supply shortages, and the potential for rising corporate tax rates in the U.S. and globally coordinated corporate taxes.
While certain sectors, such as technology and pharmaceuticals, could be shielded from margin erosion, others may experience increasing pressures as a result of rising wages. As usual, much depends on what happens next—both in terms of the economic reopening in general and the policy response to particular concerns.
Policy Impact
What does all this mean for policy?
Fed chair Jerome Powell noted that the job market still has “some ground to cover” before the Fed will start to reduce support for the economy.[10] To that end, the Fed recently reaffirmed its intention to let inflation rise “moderately above 2% for some time” so that long-term expected inflation remains anchored at 2% per year.[11]
In the meantime, the Senate has passed a landmark infrastructure spending plan with a bipartisan 69-30 vote. The $1 trillion package adds $550 billion in infrastructure spending—one of the largest such investments in decades.[12]
The actual impact of this legislation on economic growth remains to be seen, as it now goes to the House of Representatives. House Democrats have tied the infrastructure plan to a larger $3.5 trillion antipoverty and climate proposal that is likely to face substantial opposition.
Expectations for the Future

A fascinating global survey by Natixis, a French financial institution, found that individual investors in the U.S. expected annual long-term investment returns to average 17.5% before inflation.[13] This is a pretty enormous number by any measure—by way of comparison, the long-term return of the S&P 500 is under 10%.[14]
Natixis suggests that this may be driven in part by recency bias, which is the tendency to extrapolate long-term trends from short-term data. This is a human response, but it can get investors into trouble.

As we’ve said again and again, it’s important to look at the big picture and develop a strategy that serves your long-term interests. It might not be as exciting as going all-in on the latest meme stock or by betting big on the persistence of the rebound, but it’s also (in our experience) less likely to get you in trouble.
There is potential volatility ahead and it does seem that the magnitude of the rebound is likely to moderate over the coming quarters. We still face potential economic uncertainty in light of the delta variant, and there could be costs resulting from the pandemic that we haven’t yet accrued.
In our view, the long view is the one that will help investors best navigate these short-term pressures. While we very much share in the enthusiasm that a return to family gatherings has given us, we’re focusing our attention on the longer-term when it comes to our clients.
As always, please don’t hesitate to reach out with your questions and concerns—we’re here to answer and navigate this challenging summer alongside you. Please contact us to schedule mid-year reviews if needed. In the meantime, stay tuned for information about our exciting fall webinar lineup!

Download print version of the newsletter
The information expressed herein are those of JSF Financial, LLC, it does not necessarily reflect the views of Mid Atlantic Capital Corporation (MACC). Neither JSF Financial LLC nor MACC gives tax or legal advice. All opinions are subject to change without notice. Neither the information provided, nor any opinion expressed constitutes a solicitation or recommendation for the purchase or sale of any security. Investing involves risk, including possible loss of principal. Indexes are unmanaged and cannot be invested in directly.
Historical data shown represents past performance and does not guarantee comparable future results. The information and statistical data contained herein were obtained from sources believed to be reliable but in no way are guaranteed by JSF Financial, LLC or MACC as to accuracy or completeness. The information provided is not intended to be a complete analysis of every material fact respecting any strategy. The examples presented do not take into consideration commissions, tax implications, or other transactions costs, which may significantly affect the economic consequences of a given strategy. Diversification does not ensure a profit or guarantee against loss. Carefully consider the investment objectives, risks, charges and expenses of the trades referenced in this material before investing.
Asset Allocation and Diversification do not guarantee a profit or protect against a loss.
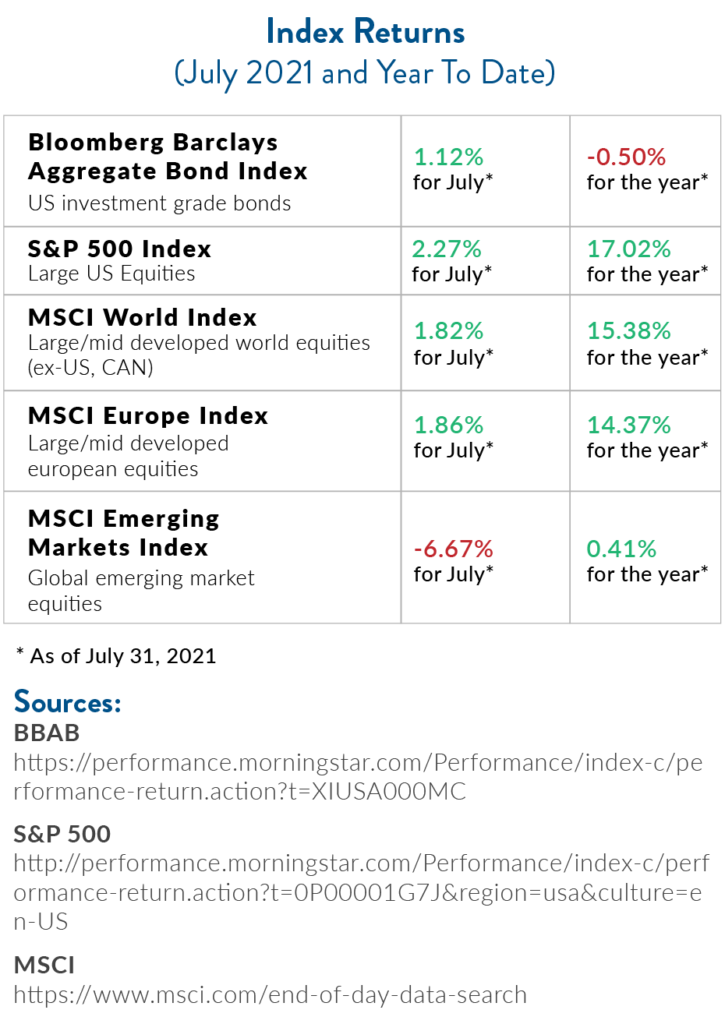
The Bloomberg Barclays U.S. Aggregate Bond Index measures the investment-grade U.S. dollar-denominated, fixed-rate taxable bond market and includes Treasury securities, government-related and corporate securities, mortgage-backed securities, asset-backed securities and commercial mortgage-backed securities.
The S&P 500 Index is an unmanaged, market value-weighted index of 500 stocks generally representative of the broad stock market.
The MSCI World Index is a broad global equity index that represents large and mid-cap equity performance across 23 developed markets countries and covers approximately 85% of the free float-adjusted market capitalization in each country.
The MSCI Europe Index captures large and mid-cap representation across 15 developed markets countries in Europe and covers approximately 85% of the free float-adjusted market capitalization across the European Developed Markets equity universe.
The MSCI Emerging Markets Index captures large and mid-cap representation across 26 emerging markets countries and covers approximately 85% of the free float-adjusted market capitalization in each country.
Gross domestic product (GDP) is a monetary measure of the market value of all the final goods and services produced in a specific time period. GDP is the most commonly used measure of economic activity.
By clicking on these links, you will leave our server, as they are located on another server. We have not independently verified the information available through this link. The link is provided to you as a matter of interest. Please click on the links below to leave and proceed to the selected site.
Sources:
[1] Source: https://www.nasdaq.com/articles/july-2021-review-and-outlook-2021-08-02
[2] Source: https://www.cnbc.com/2021/07/29/q2-gdp-rises-at-6point5percent-vs-8point4percent-estimate.html
[3] Source: https://www.nytimes.com/2021/07/29/business/2Q-GDP-Report.html
[4] Source: https://www.nytimes.com/2021/07/29/business/2Q-GDP-Report.html
[5] Source: https://www.cnbc.com/2021/07/29/q2-gdp-rises-at-6point5percent-vs-8point4percent-estimate.html
[6] Source: https://www.wsj.com/articles/millions-of-americans-are-unemployed-despite-record-job-openings-11628587802?mod=hp_lead_pos6
[7] Source: https://www.cnbc.com/2021/07/29/q2-gdp-rises-at-6point5percent-vs-8point4percent-estimate.html
[8] Source: https://www.federalreserve.gov/newsevents/pressreleases/monetary20210728a.htm
[9] This section: https://www.blackrock.com/corporate/literature/whitepaper/bii-2021-midyear-global-outlook.pdf
[10] Source: https://www.nasdaq.com/articles/july-2021-review-and-outlook-2021-08-02
[11] Source: https://www.federalreserve.gov/newsevents/pressreleases/monetary20210728a.htm
[12] Source: https://www.wsj.com/articles/senate-set-to-pass-bipartisan-infrastructure-bill-tuesday-11628597274?mod=hp_lead_pos1
[13] Source: https://www.im.natixis.com/us/research/2021-natixis-global-survey-of-individual-investors
[14] Source: https://ycharts.com/indicators/sp_500_total_return_annual
Performance table sources:
BBAB: https://performance.morningstar.com/Performance/index-c/performance-return.action?t=XIUSA000MC